How you can use data visualization in healthcare operations

Data visualization has become an invaluable tool for healthcare institutions nowadays. It has become a way to make sense of vast data and gain valuable insights.
With the abundance of healthcare automation and applications, processing volumes of data can be overwhelming for medical practitioners. This can be more complex when they are handling their own practice.
This article will explore the different aspects of data visualization in healthcare and its importance in medical operations.
What is data visualization in healthcare?
Data visualization in healthcare refers to the process of presenting complex healthcare data in a visual and easily understandable format.
It uses charts, graphs, and other visual tools to represent data gathered from findings, medical transcriptions, and other forms of information.
Turning data into a visualized presentation can help medical professionals better track trends and identify patterns for optimized patient care.

Examples of data visualization in healthcare
Numerous examples of data visualization are used in the healthcare industry to improve operations and patient care.
Dashboards for emergency rooms
One example is using dashboards that display real-time data on waiting times in emergency rooms. This helps hospital administrators identify bottlenecks and take immediate action to improve patient flow.
Charts for patient outcomes
Another example is the visualization of patient outcomes. By plotting patient data over time on a graph, medical professionals can identify patterns and trends in patient progress.
This information can then tailor treatment plans and improve patient experience in general.
Importance of data visualization in healthcare
Data visualization plays a crucial role in healthcare for several reasons:
Enhanced decision support
Firstly, it enhances decision-making by clearly and concisely representing complex data.
Large datasets can be overwhelming. However, visualizations make patterns and connections more evident, enabling healthcare professionals to make better-informed decisions.
Transparency
Secondly, data visualization promotes transparency and accountability in healthcare operations.
Healthcare organizations can identify areas that require improvement and track progress for patient outcomes, surgical success rates, or medication errors.
Transparency fosters a culture of accountability and drives continuous improvement in the quality of care provided.
Enhanced collaboration
Lastly, data visualization improves collaboration among healthcare professionals.
Visual representations of data are more accessible and easier to understand than lengthy reports or spreadsheets.
By presenting data visually, healthcare professionals can effectively communicate findings, engage stakeholders, and foster collaborative efforts to drive positive change.
Data visualization techniques in healthcare
Various data visualization techniques are used in healthcare operations to represent complex information effectively. Here, we will explore three popular techniques:
1. Line graphs
Line graphs are commonly used in healthcare to track trends and changes. For instance, a line graph can be utilized to visualize the fluctuations in patient vital signs, such as heart rate or blood pressure.
Healthcare professionals can spot abnormal trends and intervene promptly by plotting this data on a line graph.
2. Heatmaps
Heatmaps are visual representations that use color coding to show patterns and variations across a dataset.
In healthcare, heatmaps can be used to visualize patient demographics or disease prevalence across different regions.
Utilizing heatmaps allows healthcare professionals to identify areas with higher rates of certain diseases, enabling them to allocate resources efficiently.
3. Geographic information systems (GIS)
GIS is a powerful data visualization technique that combines geographic data with other data types to provide valuable insights.
In healthcare, GIS can be used to map disease outbreaks, track the spread of infectious diseases, or identify regions with underserved populations.
Healthcare organizations can make informed decisions and allocate resources effectively by incorporating spatial data.
Interpreting data in healthcare operations
While data visualization is crucial, interpreting the visualized data is equally important in healthcare operations. Medical professionals should be able to analyze, interpret, and draw meaningful insights from the visualized data.
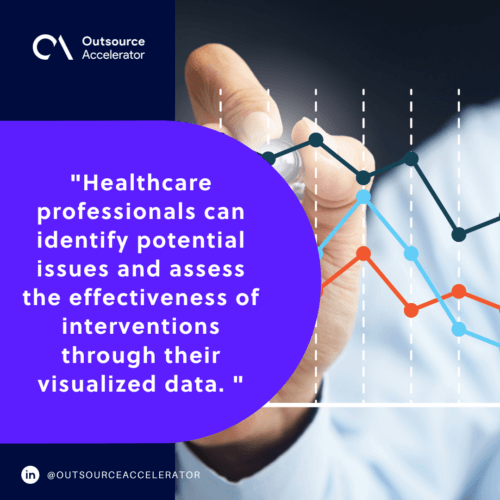
Healthcare professionals can identify potential issues and assess the effectiveness of interventions through their visualized data.
Additionally, effective interpretation of data visualization in healthcare can lead to:
- Improved patient outcomes
- Reduced costs
- Increased efficiency in healthcare operations

Partner with Connext Global for effective data visualization solutions
Connext Global offers cutting-edge data visualization solutions tailored to the healthcare industry’s unique needs. Apart from the technology, it employs talented offshore teams to help streamline processes and consolidate data.
To learn more about data visualization and how it can benefit your healthcare operations, visit Connext Global.


 Independent


